Ann Marie Cody
Astronomer

Precision photometric monitoring of very low mass σ
Orionis cluster members: variability and rotation at a few
Myr
Abstract:
We present high-precision photometry on 107 variable
low-mass stars and brown dwarfs in the ~3 Myr Sigma Orionis open cluster. We
have carried out I-band photometric monitoring within two fields, encompassing
153 confirmed or candidate members of the low-mass cluster population, from 0.02
to 0.5 M☉. We are sensitive to brightness changes on time scales from
10 minutes to two weeks with amplitudes as low as 0.004 magnitudes, and find
variability on these time scales in nearly 70% of cluster members. We identify
both periodic and aperiodic modes of variability, as well as semi-periodic rapid
fading events that are not accounted for by the standard explanations of
rotational modulation of surface features or accretion. We have incorporated
both optical and infrared color data to uncover trends in variability with mass
and circumstellar disks. While the data confirm that the lowest-mass objects (M
< 0.2 M☉) rotate more rapidly than the 0.2-0.5 M☉
members, they do not support a direct connection between rotation rate and the
presence of a disk. Finally, we speculate on the origin of irregular variability
in cluster members with no evidence for disks or accretion.
Astro-ph pre-print: arxiv:1011.3539
Journal article: 2010 ApJS, 191, 389
Electronic figures: Figure 5,
Figure 7
Fig. 5 – Differential light curves with detected periodic
variability, in order of right ascension. First and third rows
show the original light curve, while those in the second and
fourth rows are phased to the detected period. There are also a
few that are not likely cluster members; membership status is
listed in Table 3 of the paper.
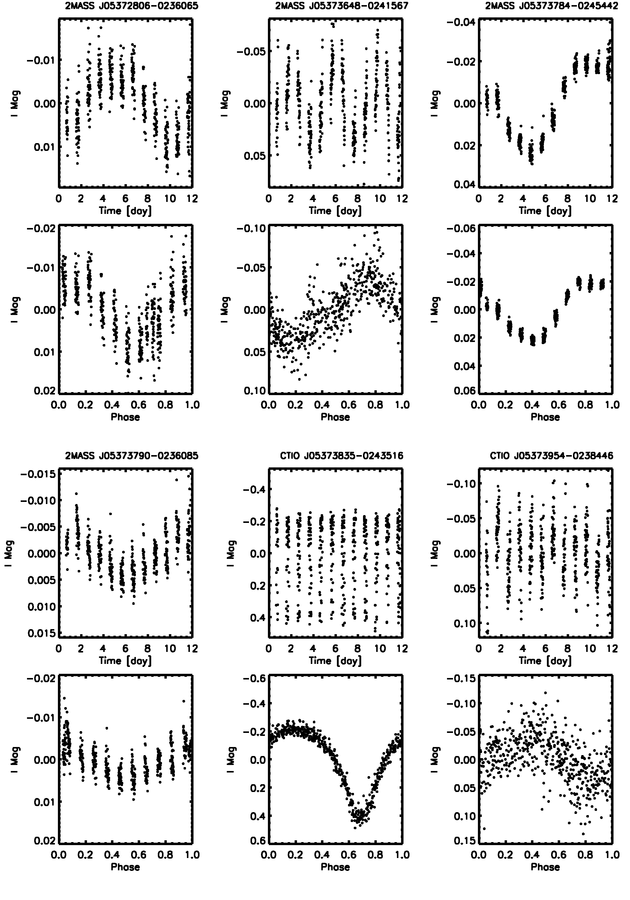
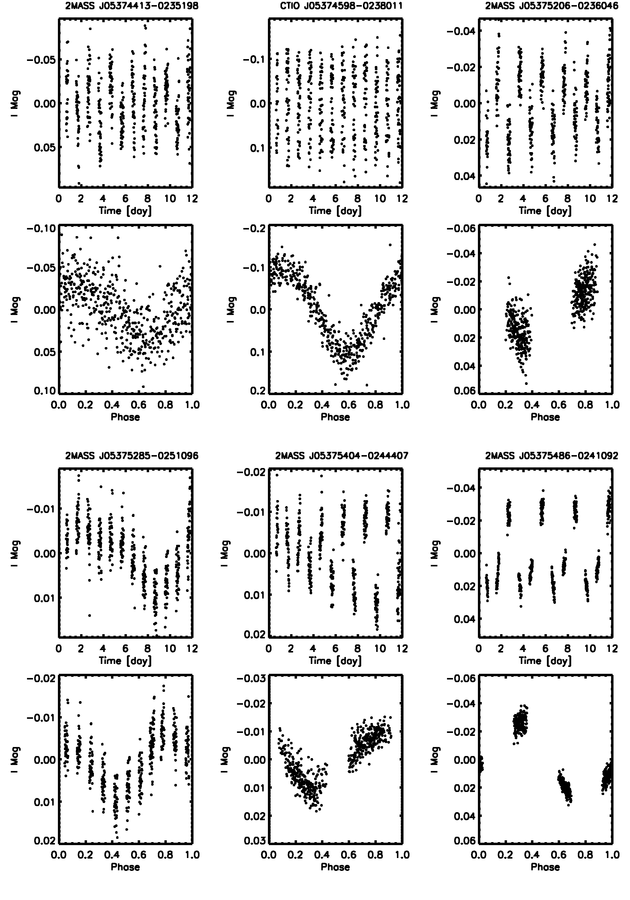
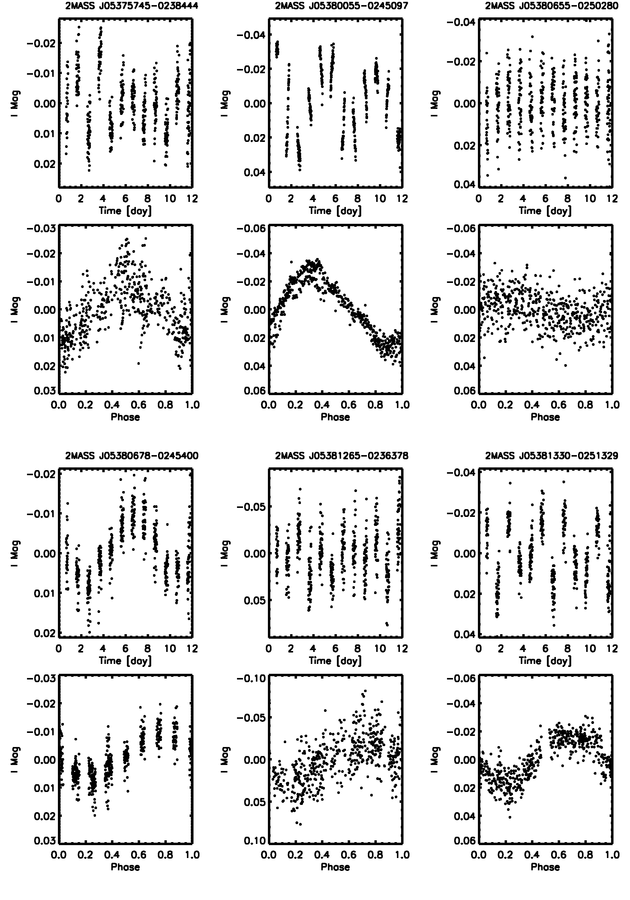
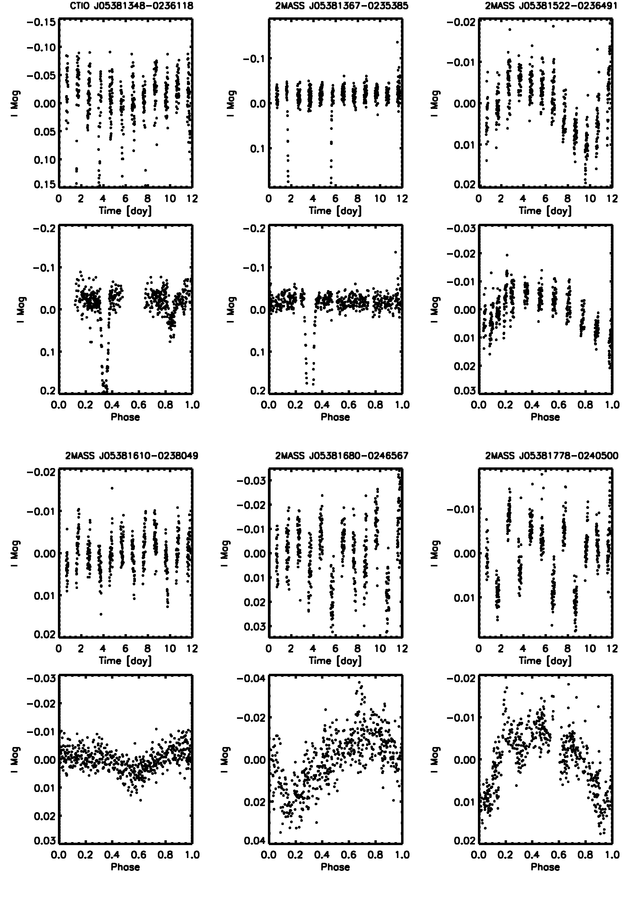
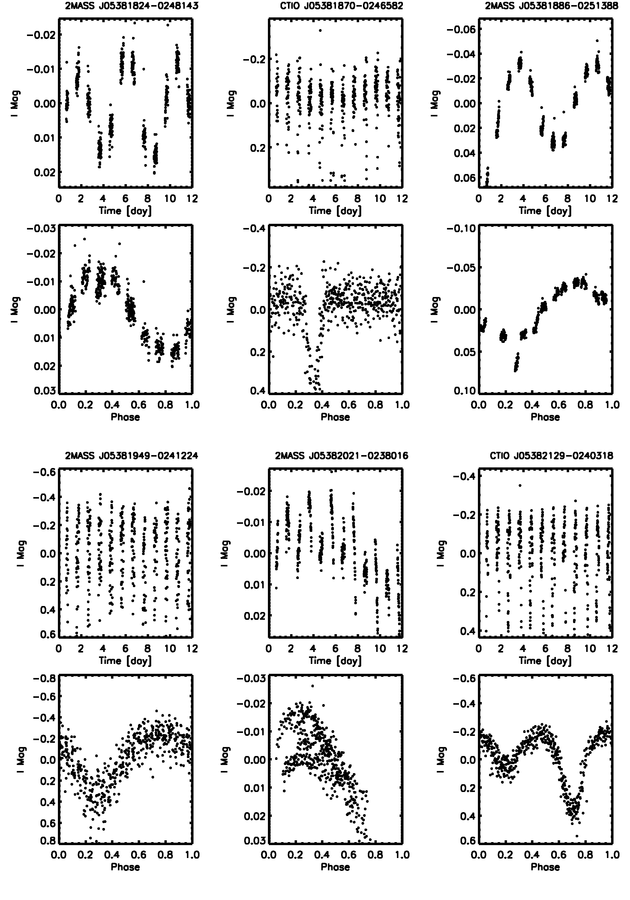
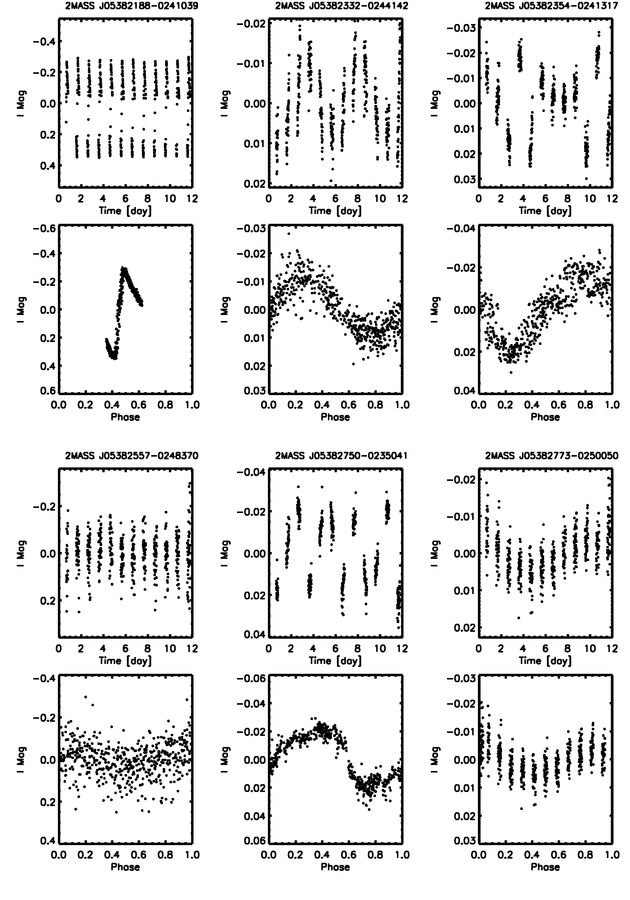
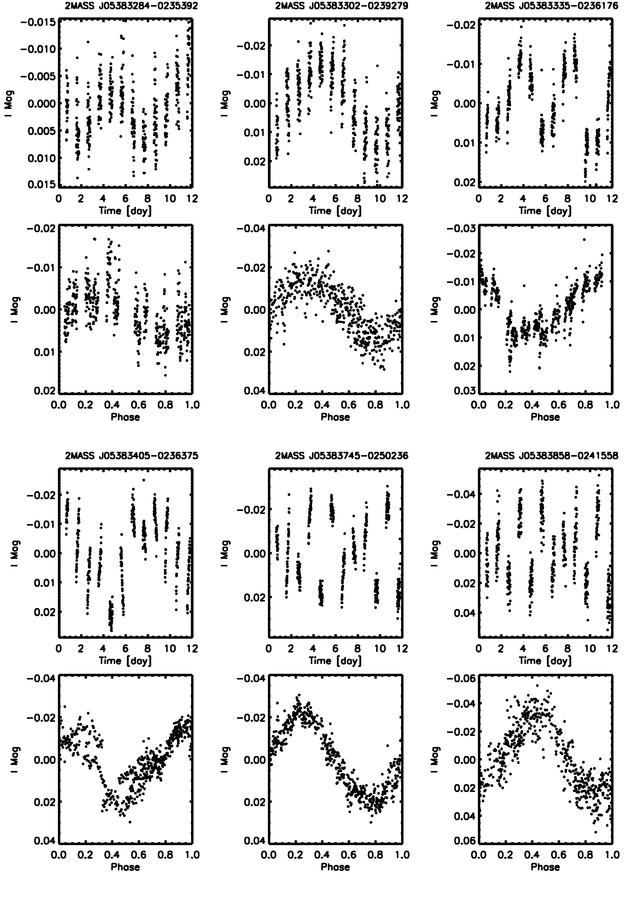
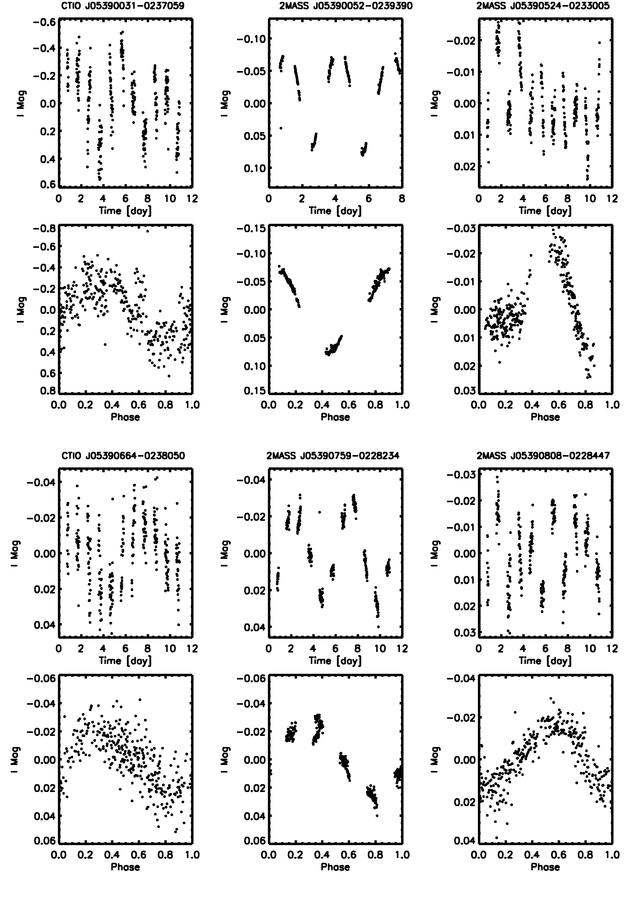
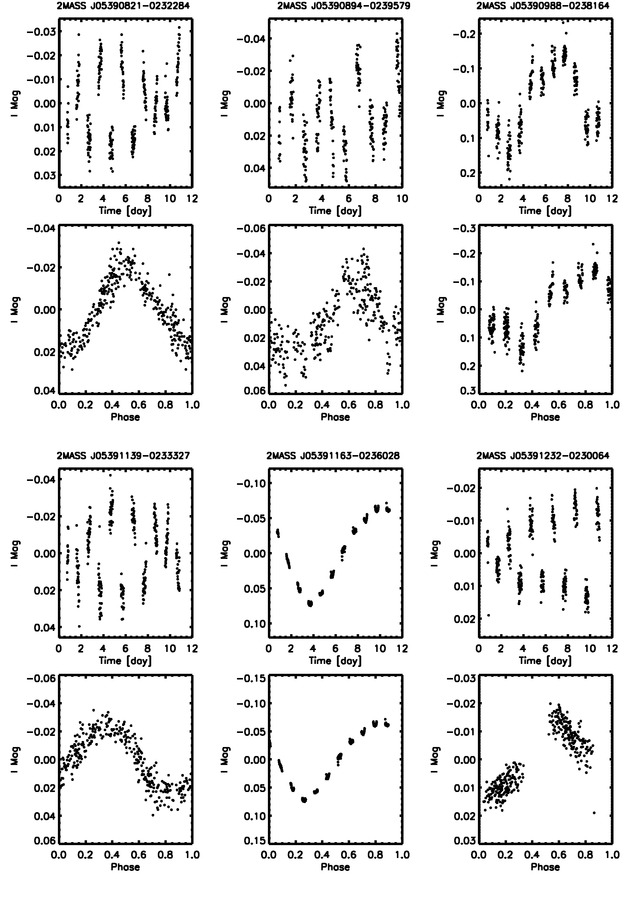
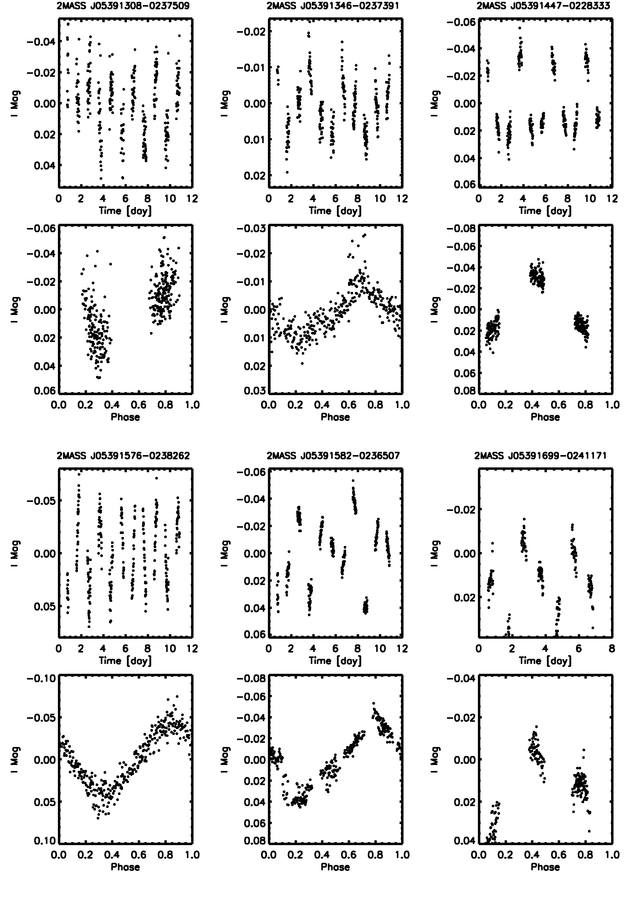
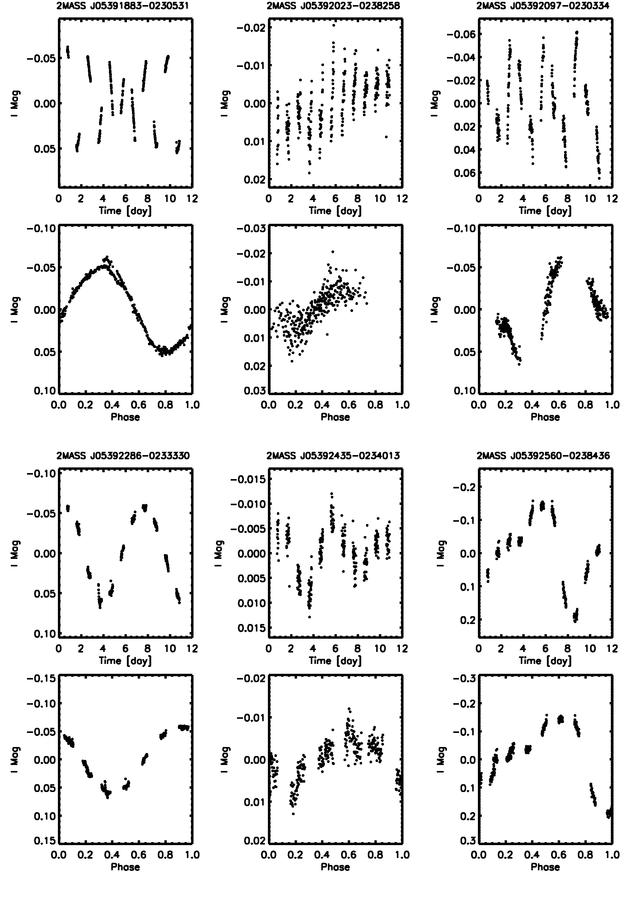
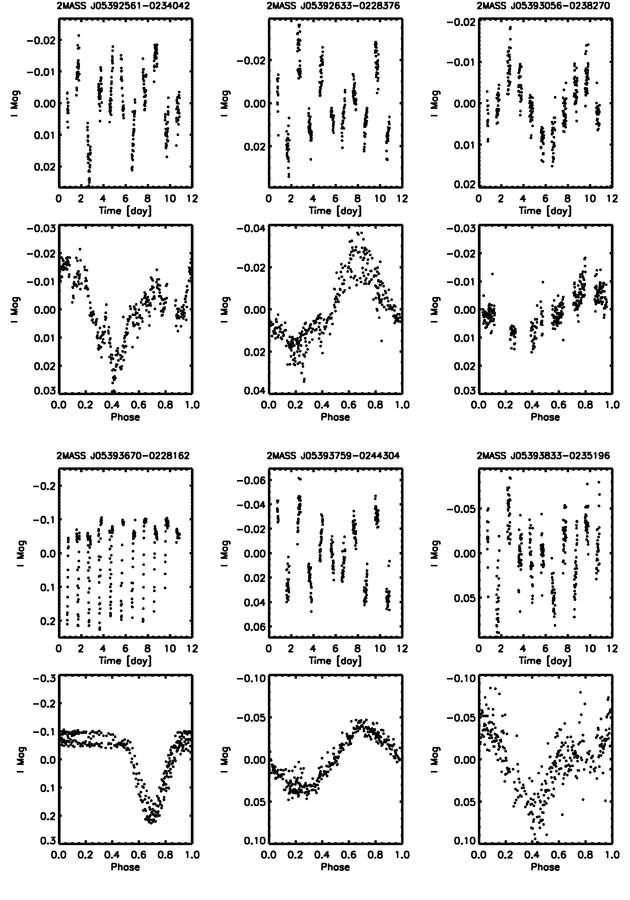
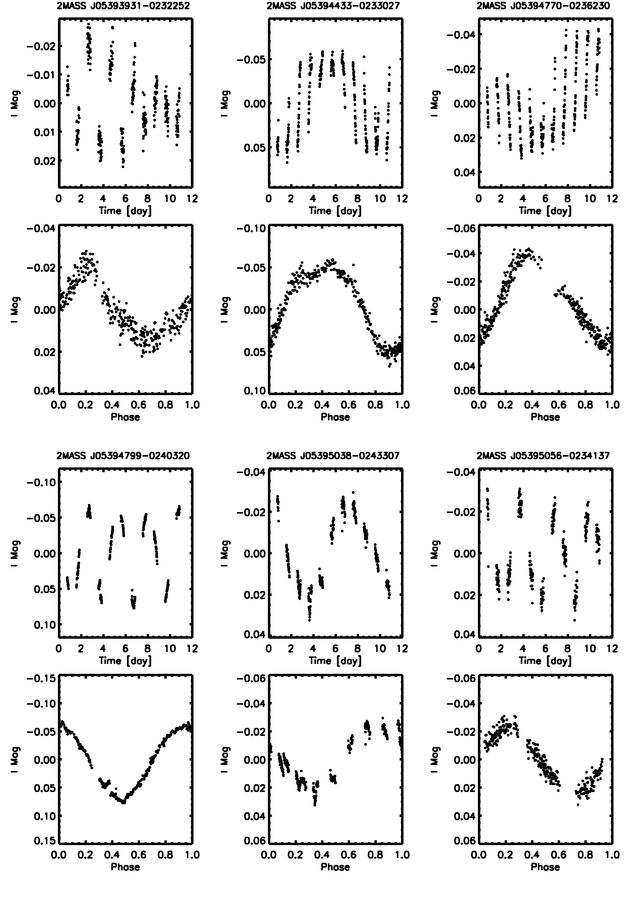
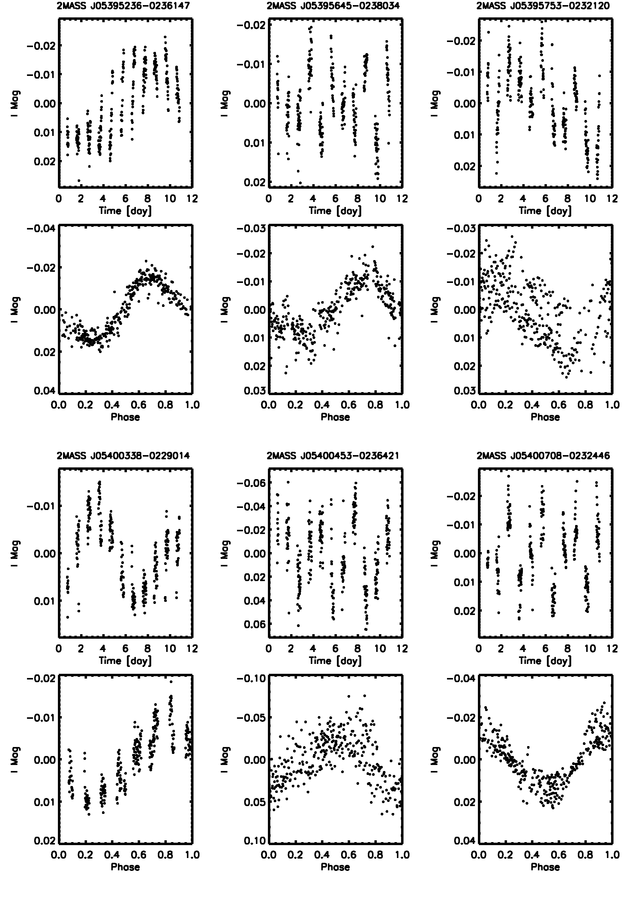
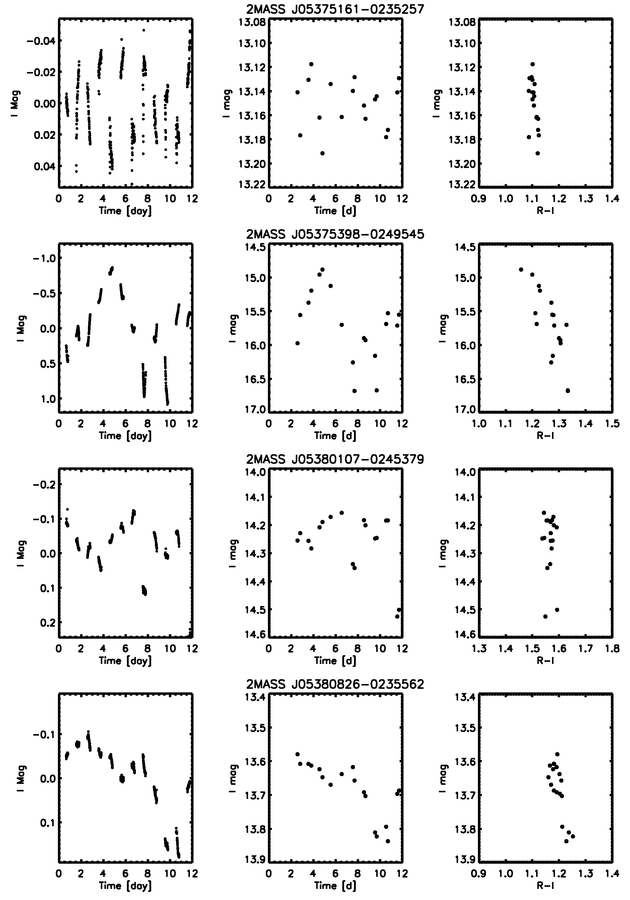
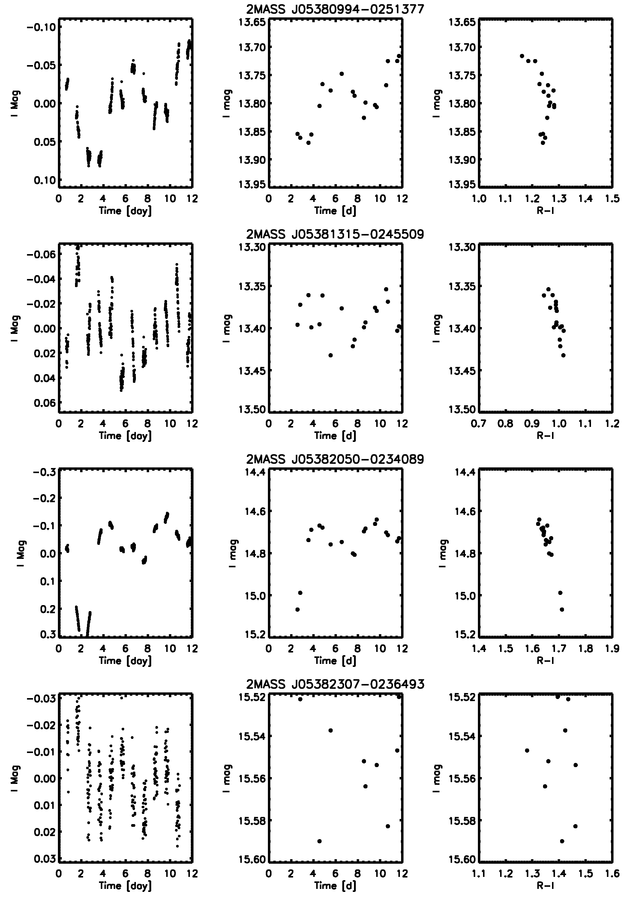
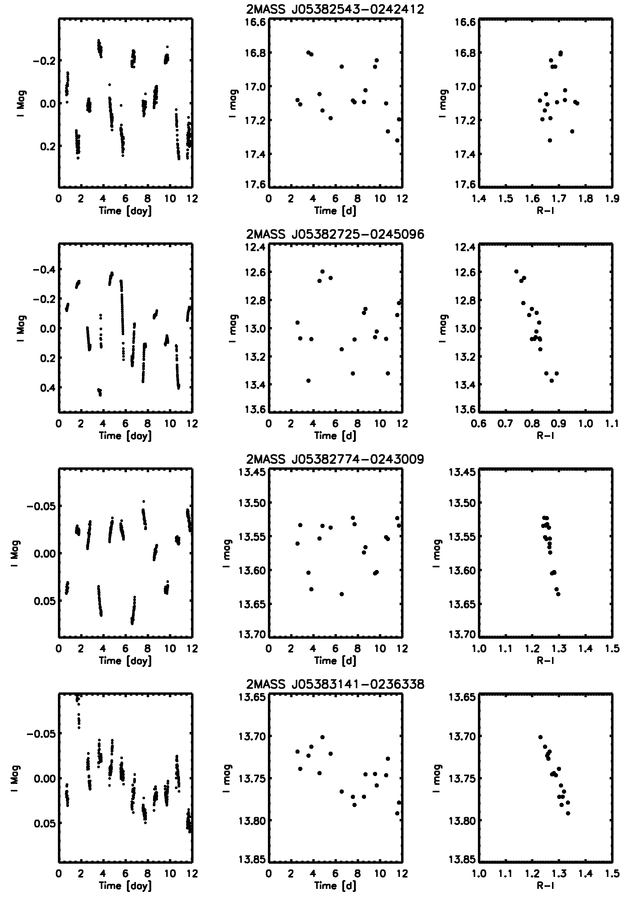
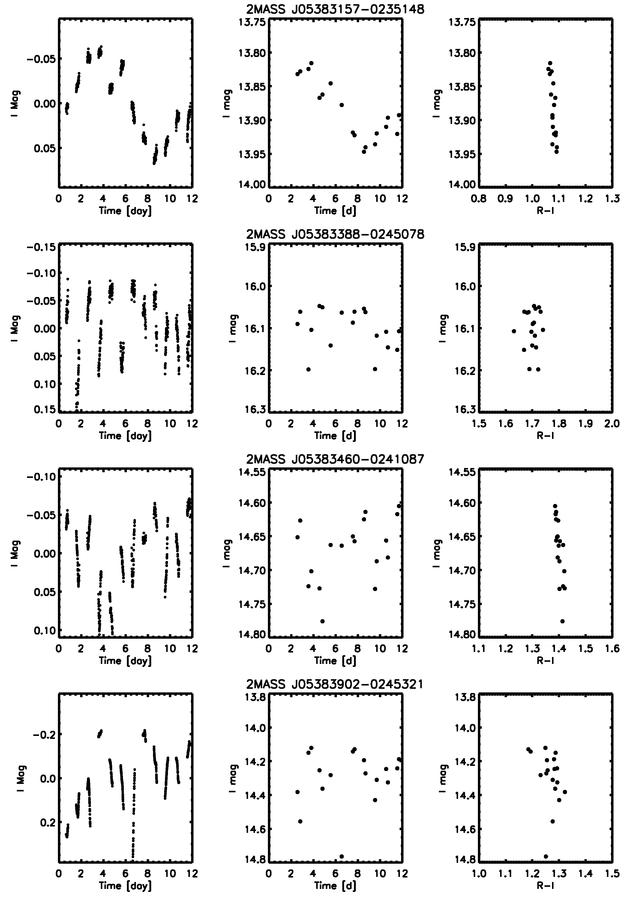
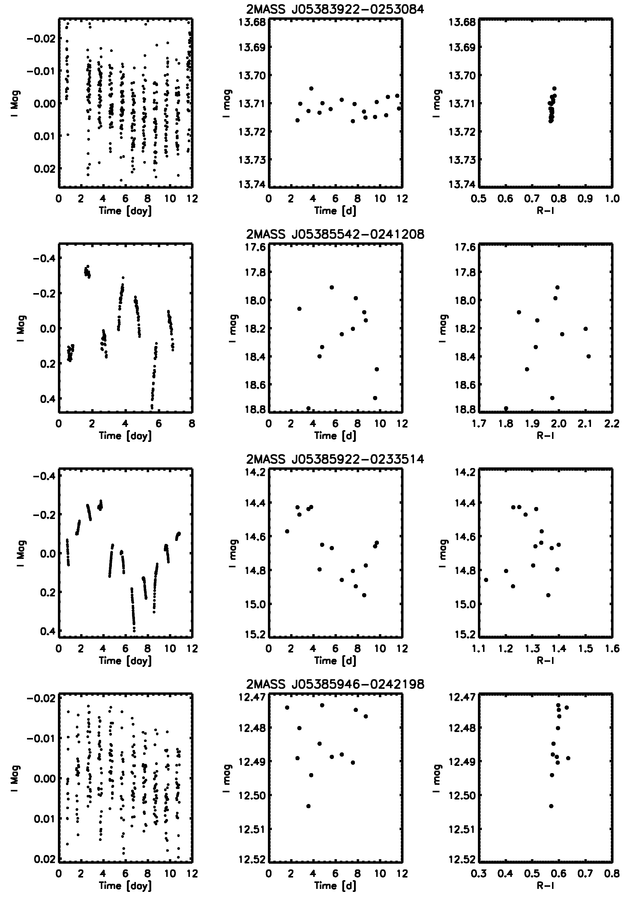
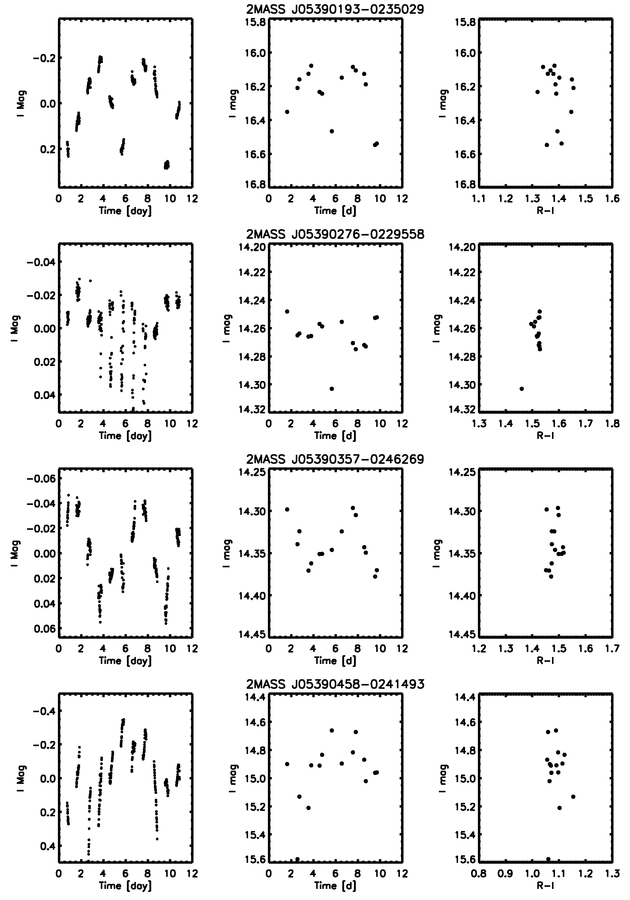
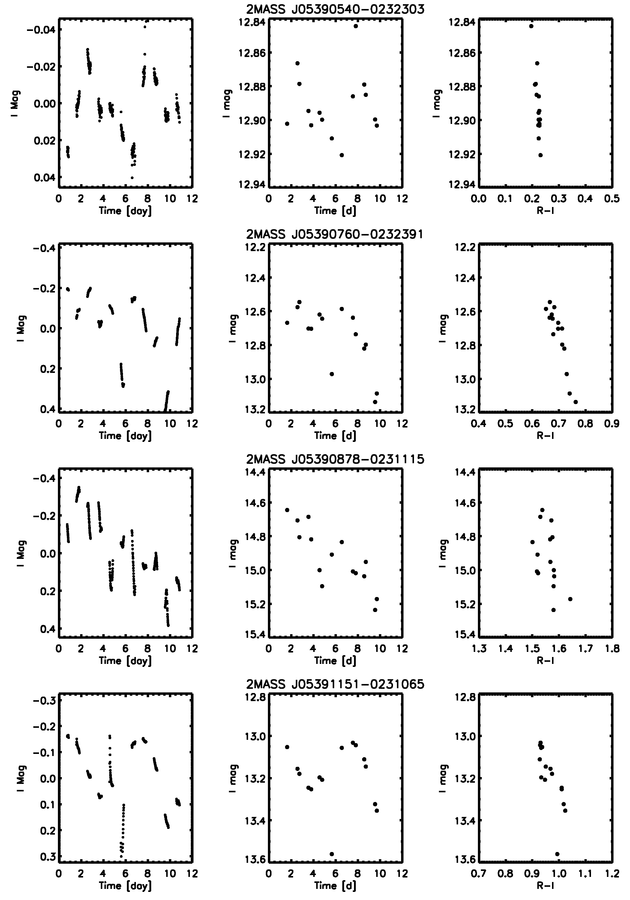
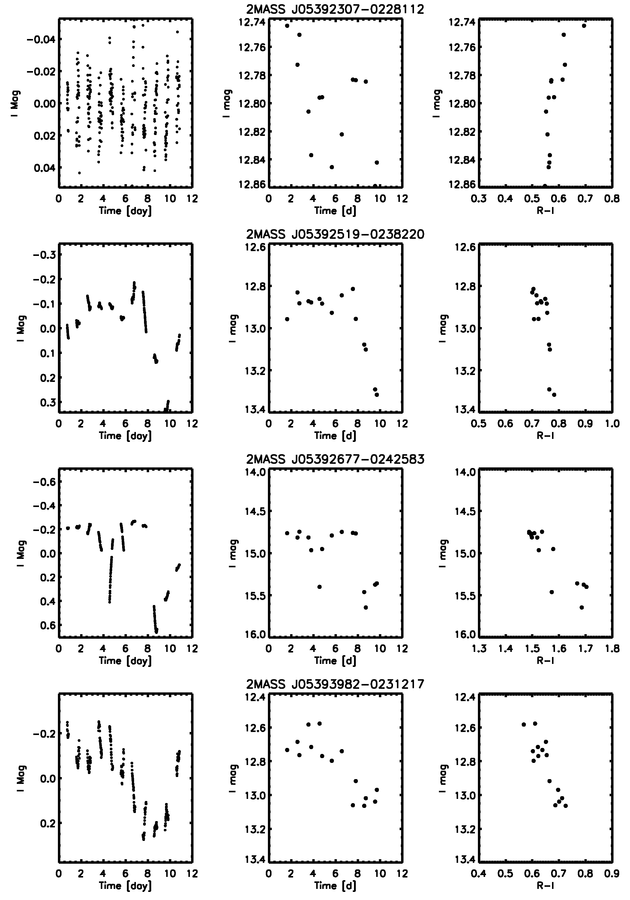
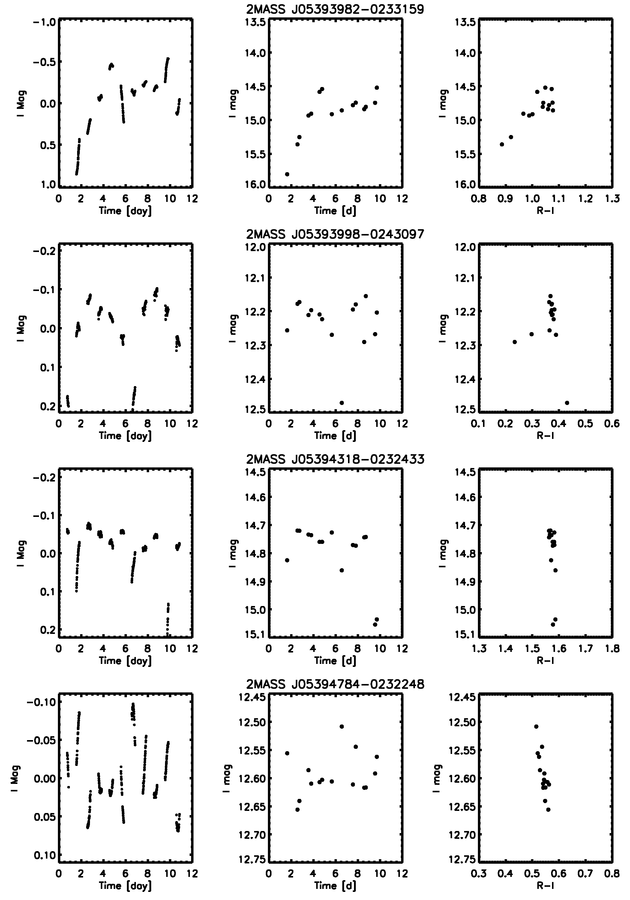
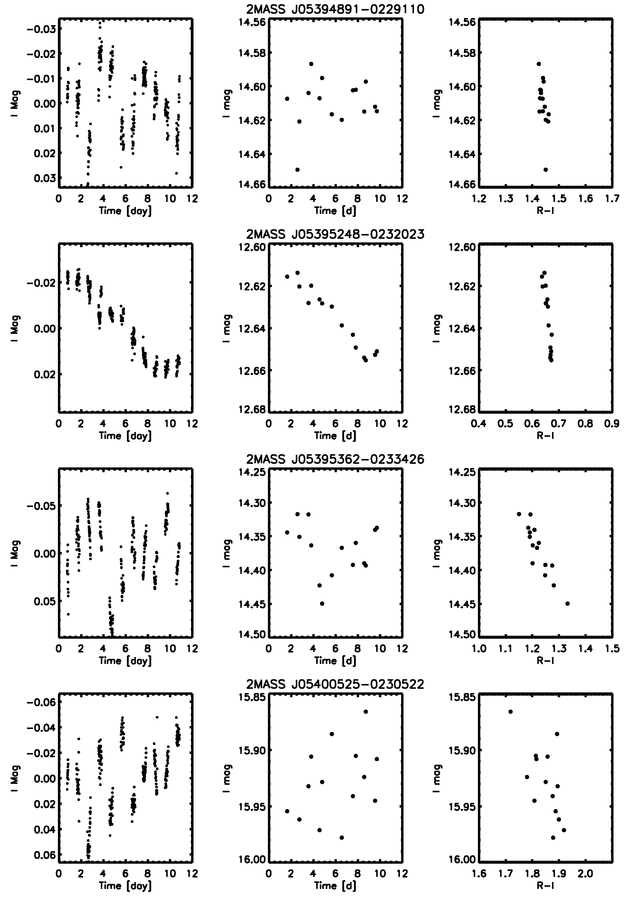
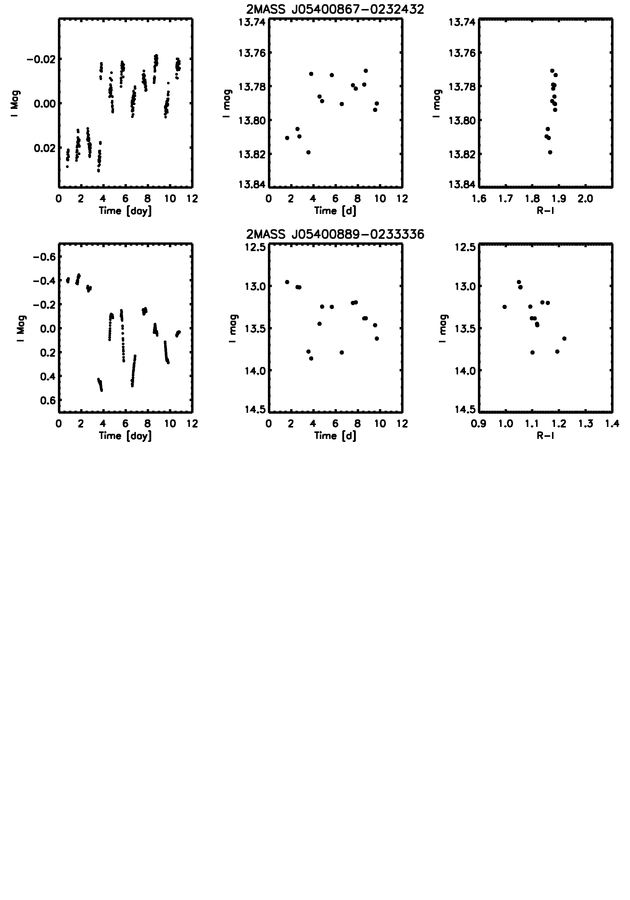
Fig. 7 – Light curves selected as aperiodic based on large
χ2 values and lack of periodicities. Objects are arranged in order of
right ascension, and membership information is available in Table 4 of the
paper. The left column displays the full I-band light curves, while the middle
shows the same data at the reduced cadence corresponding to the R-band
observations. The right column shows R-I color trends.